Real-valued functions of several variables
Functions that take in several real variables and output a single real number.
The definition for functions of more than one variable is quite similar to the definition for functions of one variable that we studied in basic calculus. In this lecture we develop the fundamental concepts and tools for doing calculus with functions of several variables.
Real-valued functions of two variables
The definition for functions of two variables is quite similar to the definition for functions of one variable that we already studied.
These functions can be visualized as mappings between the 2-dimensional plane and the 1-dimensional real line, and they naturally appear in many applications. We have to develop a few new tools in order to do calculus with these functions.
Given a subset $D$ of the (real) plane $\mathbb{R}^2$, a (real-valued) function of two variables on $D$ maps each ordered pair $(x,y)$ in $D$ to a unique real number $z$.
Here $D$ is called the domain of $f$, and the range of $f$ is the set of all real numbers $z$ that has at least one ordered pair $(x,y)$ in $D$ such that $f(x,y) = z$.
In this case, we can see the range is the set of all nonnegative real numbers.
Graphs of functions in two variables
For a given function $f(x,y)$ in the two variables $x$ and $y$, the set of points $(x,y,f(x,y))$ with $(x,y)$ in its domain is called the graph of $f$.
In other words, the function value $f(x,y)$ provides the $z$ value of any point in the graph of $f$.
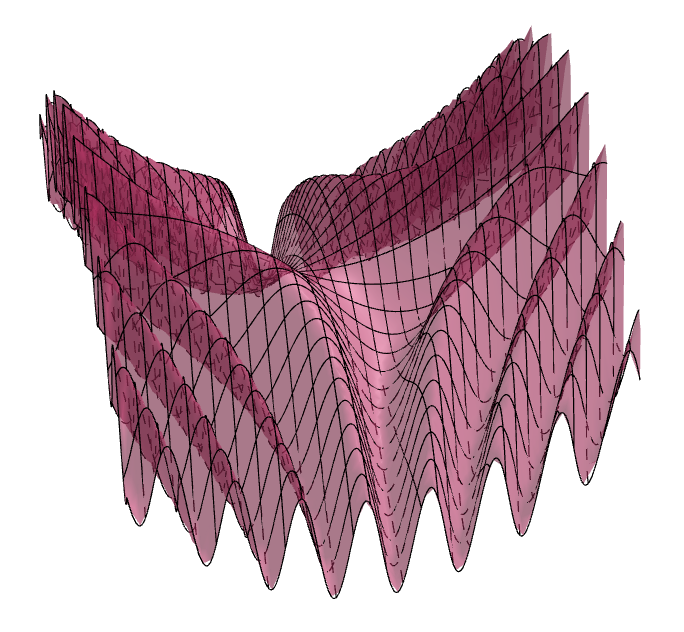
For example, the following image shows the surface that is the graph of the function \[ f(x,y) = \frac{x^2}{10} - \frac{y^2}{10} + \sin(xy). \]
Contour lines and level curves
Visualizing a surface in space is not always easy. We often have to rely on their 2-dimensional representations similar to topographical maps.
A topographical map use contour lines to represent terrains that are not flat. They represent points having the exact same elevation.
In our context, the curves equivalent to contour lines are called level curves.
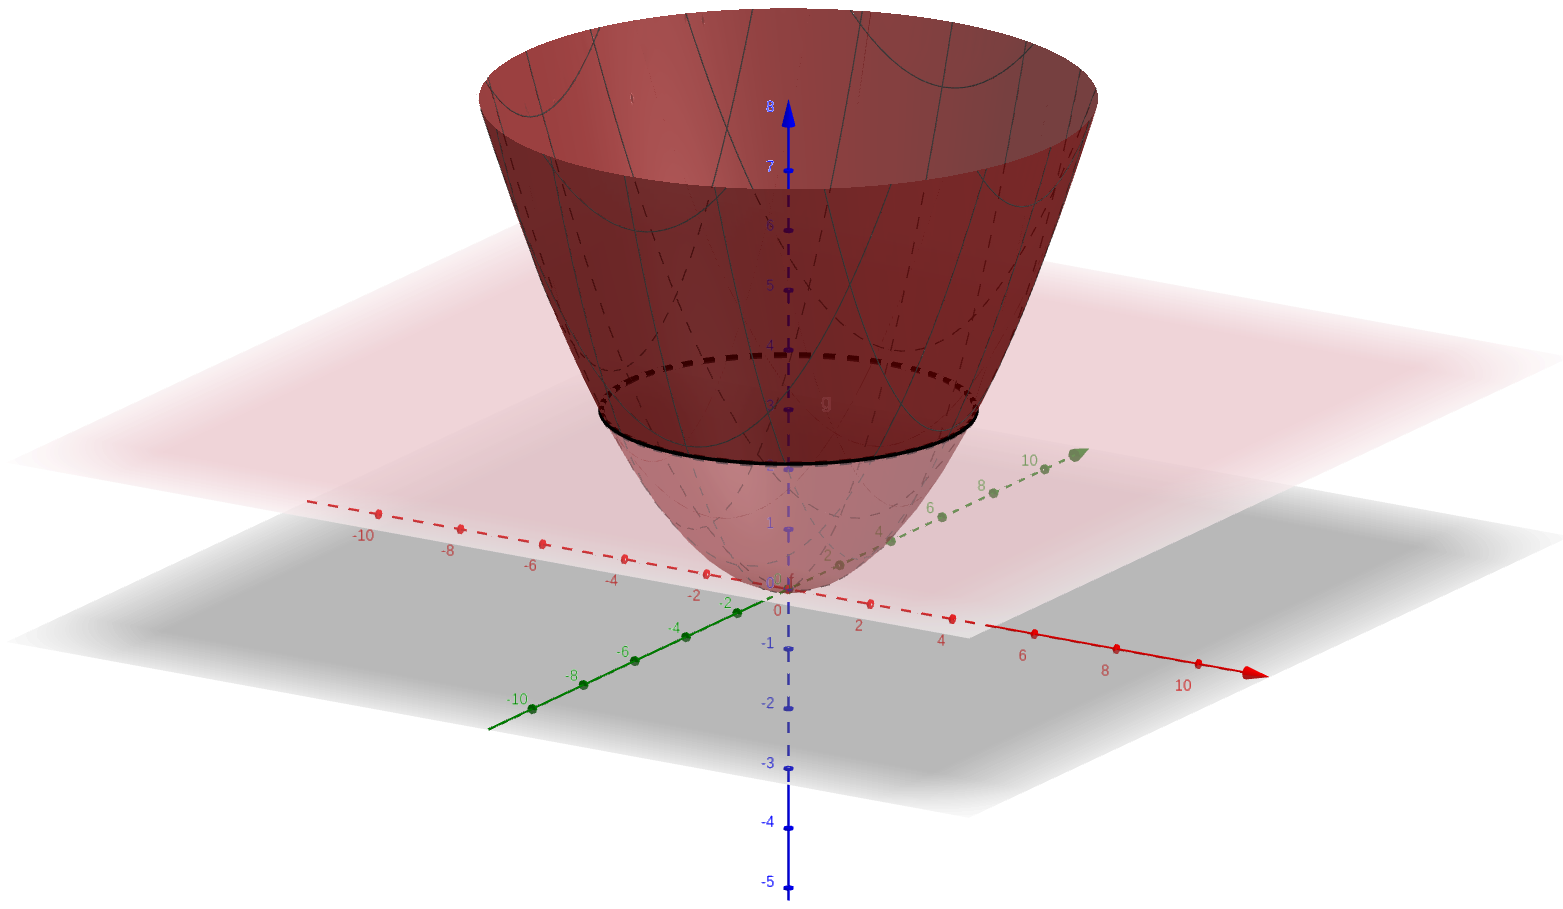
It is also the intersection between the graph of $f$ and a plane defined by $z=c$.
An simple example
For the function \[ f(x,y) = \frac{x^2+y^2}{5}, \] and a nonnegative real number $c$, the level curve at value $c$ is simply the curve defined by \[ \frac{x^2+y^2}{5} = c. \]
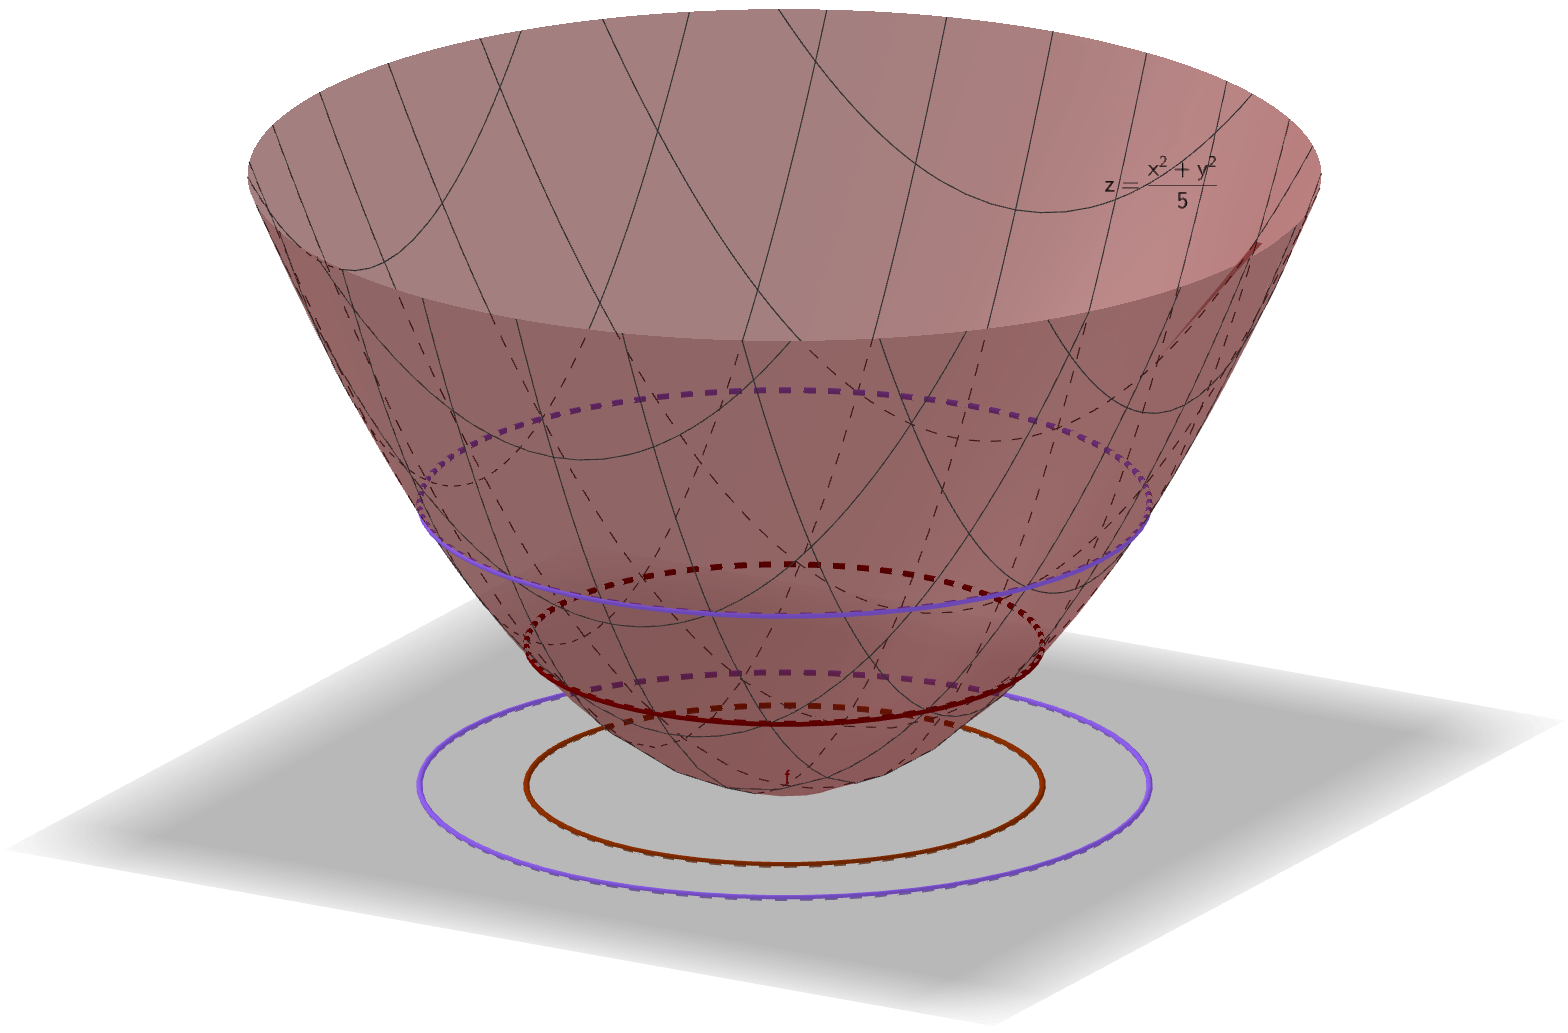
We can see the level curves at values $c=1$ and $c=2$.
In this figure, we can also see that the level curves are projection of points having the same "height" (just like in a topographical map).
Exercises
While it is easy to sketch these level curves using computer programs (or graphing calculators), you should at least try to do these by hand, at least once.
Functions of several variables
Everything we just described can be easily generalized to functions of more than two variables.
Here $D$ is called the domain of $f$, and the range of $f$ is the set of all real numbers $y$ that has at least one point $(x_1,\dots,x_n)$ in $D$ such that $f(x_1,\dots,x_n) = y$.
Level surface and level set
We can generalize the concept of level curves to functions in three variables, and the resulting objects are called level surface.
We can generalize this idea much further to functions in $n$ variables, and the equivalent objects will be called level sets.
Terms like level curve and level surface are not to be taken literally. It is possible for a level curve to not be a curve at all, and it is possible for a level surface to not be surface in the normal sense of the word. For example, we can see that the level curve of $f(x,y) = x^2 + y^2$ defined by $f(x,y) = 0$ consists of a single point.